I’ve noticed that many in our industry assess performance at a whole-of-business or perhaps departmental level and they lack the ability to see performance by Product Code.
They are measuring an average level of performance. The issue is the larger and more diverse the product range, the more crucial it becomes to have a finer-grained view of your star products and underperformers. The range is actually an investment portfolio.
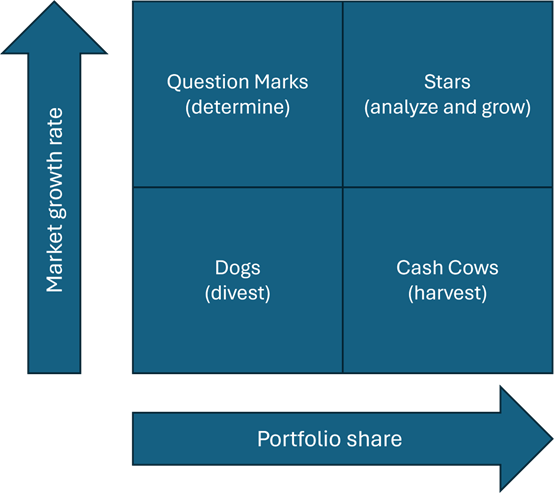
One method I use to help see our range as a portfolio (and make it more useful for SMB) is to hack the well known BCG matrix and classify products into Stars, Cash Cows, Problem Children and Dogs using a couple different methods.
Hack 1: I replace the Market Share axis with Portfolio Share. This helps to clearly identify where growth is being driven from relative to our business and which products in the portfolio require attention.
and then
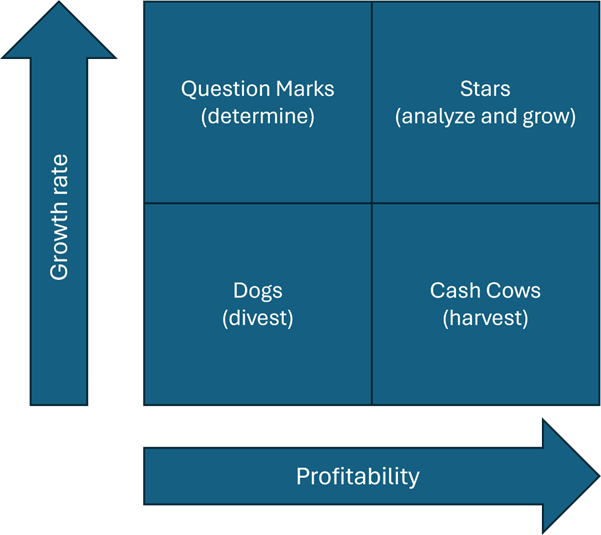
Hack 2: Rather than focussing only on growth and outlook using this technique, I also examine relative profitability (cash is king in SMB) against portfolio share. In doing that I look at it as a 2-stage macro and micro analysis:
Macro: By Primary Product Group (and maybe Secondary Product Group) and then plotting those
Micro: Drilling down to major component types within a Product Group and re-plotting
Putting that into an example, when I first applied this approach to our retail business (which is in consumer photo POD), photo book revenue emerged as the clear engine room of the business – nothing particularly insightful there. But, what the micro plot showed was the massive importance of the number of extra pages ordered by consumers and the significance as a key profit driver.
The micro plot critically revealed that the bigger the dimension of the book, the higher the average page count – up to a 12×12 book size. For us that was a stunning insight that led to the creation of a whole new promotional strategy specifically geared into tapping into this pattern and incenting the consumer ordering behavior to amplify it even further.
The key takeaway is the importance of viewing everything made from a portfolio perspective. By plotting relative growth and relative profitability, big insights can be realized that can be a strategy game-changer.